
Incrementality testing in Google Ads is suddenly within reach for far more advertisers than before.
Google has lowered the barriers to running these tests, making lift measurement possible even without enterprise-level budgets, as recently reported in Search Engine Land.
That shift naturally raises a question: How is Google able to measure incrementality with so much less data?
For years, reliable lift measurement was assumed to require large budgets, long test windows, and a tolerance for inconclusive results.
So when Google claims it can now deliver more accurate results with as little as $5,000 in media spend, it understandably sounds like marketing spin.
But it’s not. It’s math.
Behind this change is a fundamentally different testing methodology that prioritizes probability over certainty and learning over rigid proof.
Understanding how this approach works is essential to interpreting these new incrementality results correctly – and turning them into smarter PPC decisions.
Glossary: Bayesian terms for search marketers
Before we dive in, here are some definitions to refresh your memory from Stats 101.
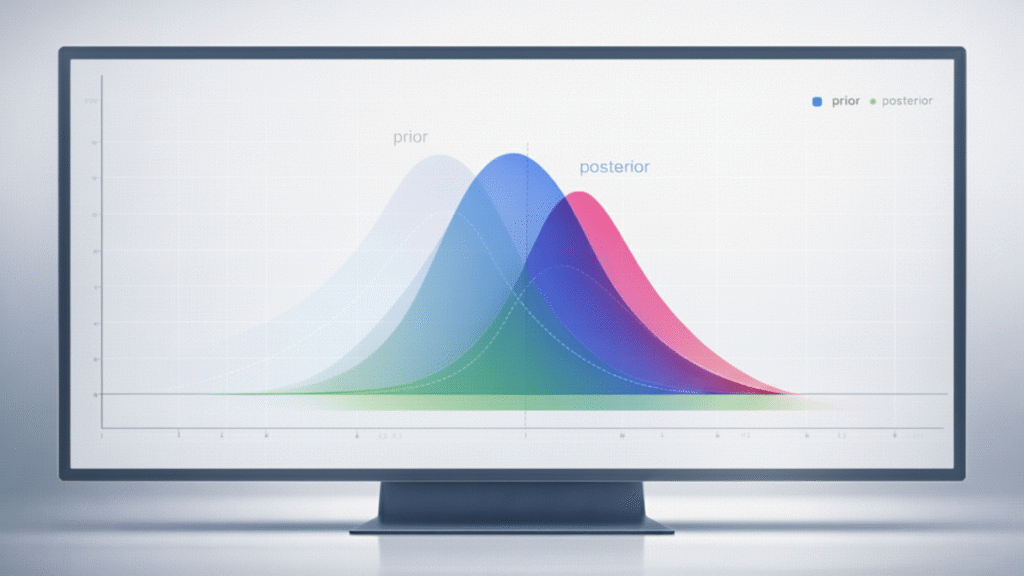
- Prior: What the system believes before the test.
- Posterior: Updated belief after observing data.
- Credible interval: Where the result likely falls (Bayesian).
- P-value: Probability of observing this result if nothing changed (Frequentist).
Why traditional A/B testing fails modern marketers
Most PPC advertisers are already familiar with frequentist statistics, even if they’ve never heard the term.
Any classic A/B test that asks “Did this change reach statistical significance?” and relies on p-values and fixed sample sizes to answer that question is using a frequentist framework.
It’s the model that underpins most experimentation platforms and has shaped how marketers have been taught to evaluate tests for decades.
Let’s look at what that means for a realistic, smaller-budget test.
For simplicity, assume a click-based experiment with equal exposure to both variants.
- Total test budget: $5,000.
- Split: 50/50 → $2,500 per variant.
- Average CPC: $2.
- Clicks per variant: 1,250.
- CPA target: ~$100.
Observed results
- Control: 1,250 clicks → 25 conversions → 2.00% conversion rate.
- Treatment: 1,250 clicks → 30 conversions → 2.40% conversion rate.
- Observed lift: 20% more conversions, ~16.7% lower CPA.
On paper, that looks promising: better conversion rate and lower CPA for the treatment.
But when you run a standard two-proportion z-test on those rates, the result tells a very different story.
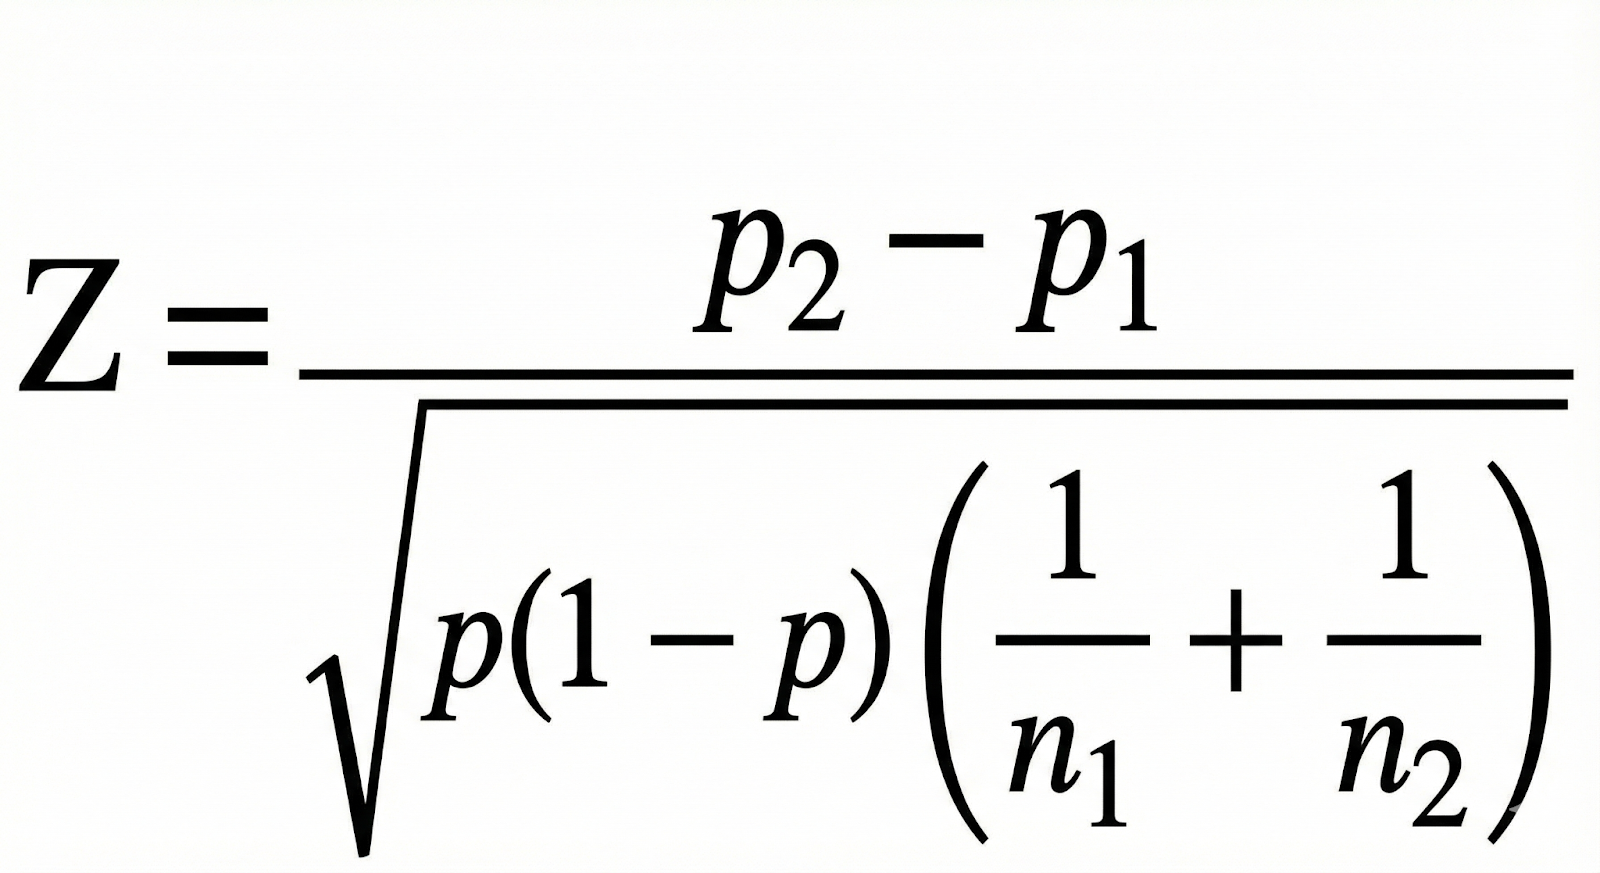
The output looks like this:
- Z ≈ 0.68
- One-tailed p ≈ 0.25
- Two-tailed p ≈ 0.50
In other words, under a traditional frequentist framework, this test is not statistically significant.
A 20% lift and a visibly better CPA are still treated as “could easily be noise.”
The advertiser has spent $5,000, seen…
Source link
Disclaimer
We strive to uphold the highest ethical standards in all of our reporting and coverage. We blogs.grocliq.com want to be transparent with our readers about any potential conflicts of interest that may arise in our work. It’s possible that some of the investors we feature may have connections to other businesses, including competitors or companies we write about. However, we want to assure our readers that this will not have any impact on the integrity or impartiality of our reporting. We are committed to delivering accurate, unbiased news and information to our audience, and we will continue to uphold our ethics and principles in all of our work. Thank you for your trust and support.
Website Upgradation is going on for any glitch kindly connect at [email protected]