

When running a Meta Ads campaign, creative should be at the center of your strategy. As targeting options have become more limited in the platform from the super-granular segments available in years past, overthinking targeting layers often raises cost while sacrificing performance.
Meta has also been emphasizing the importance of differentiating creative, warning that similar assets will essentially be seen as the same by their system, and potentially limiting reach as audience fatigue sets in from seeing an image or video over and over.
Assuming you’ve started with a foundation of properly configured event tracking, keeping your audience targeting high-level and focusing on testing diverse creative will generally drive the best results. Given the importance of creative, understanding how you can view the performance of your assets is crucial to informing your Meta advertising strategy.
Breaking It Down
From the main Ads Manager screen, you can use the Breakdown option to segment performance by individual ad creative (images and videos). This can be done at either the ad set or ad level.
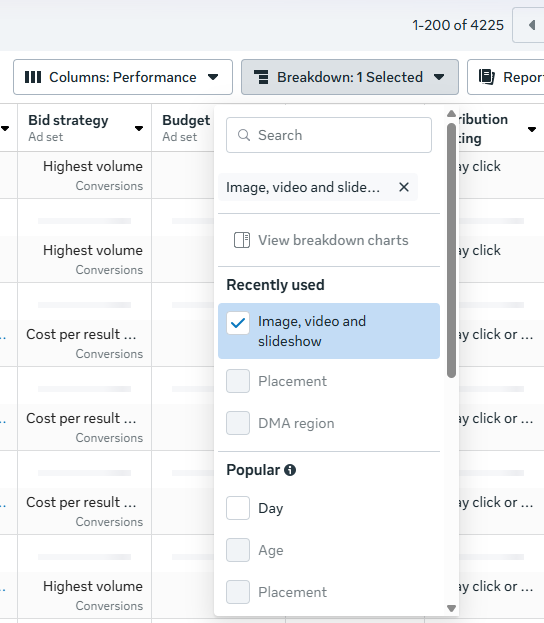 Image from author, October 2025
You can then see metrics such as clicks, link clicks, impressions, cost-per-click (CPC), click-through rate (CTR), reach, frequency, and spend for individual assets. However, you unfortunately cannot see counts for custom conversions or events broken down at this level.
While the lack of conversion data is a miss on Meta’s part, you can still find value in this reporting. If you’re using dynamic creative, you can see which individual assets are being served the most and which are receiving the highest engagement (based on CTR). You can also determine if frequency is running high for particular assets and if fatigue may be setting in.
If you’re running a single image ad without dynamic creative, but using different images for various placements (e.g., square images for feed placements and vertical images for Stories/Reels), you can still see conversion performance separated by breaking down by Placement instead of creative. Here, you can also delineate between different platforms (Facebook vs. Instagram vs. Threads) for individual placement types as well.
Custom Reporting
You can also use the Ads Reporting section to create a custom report that includes individual ad creatives in addition to metrics you’d like to see. When building your report, use a pivot table and check the box for “Ad creative” if you’d like to see data aggregated across campaigns and ad sets that are using the same creative.
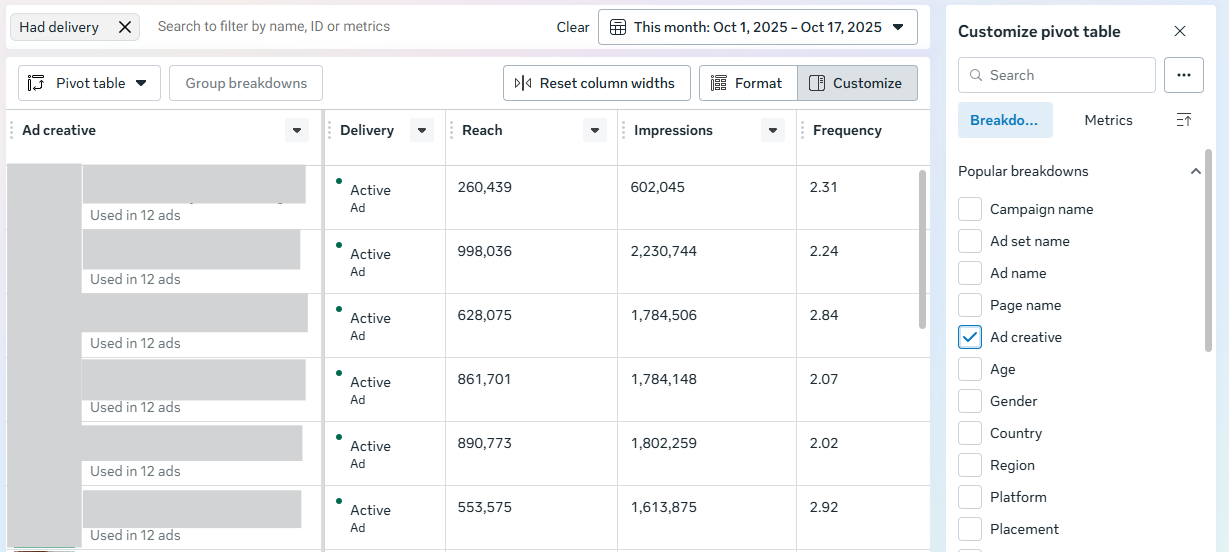 Image from author, October 2025
You’ll then see a thumbnail of the image or video, along with the accompanying copy. This report can be helpful for doing aggregate comparisons of how specific images are performing if you’re reusing them for different ad sets or campaigns. For instance, you may have campaigns segmented by market for budget reasons, but be serving the same assets.
Creative Testing
We’ve looked at how…
Source link
Disclaimer
We strive to uphold the highest ethical standards in all of our reporting and coverage. We blogs.grocliq.com want to be transparent with our readers about any potential conflicts of interest that may arise in our work. It’s possible that some of the investors we feature may have connections to other businesses, including competitors or companies we write about. However, we want to assure our readers that this will not have any impact on the integrity or impartiality of our reporting. We are committed to delivering accurate, unbiased news and information to our audience, and we will continue to uphold our ethics and principles in all of our work. Thank you for your trust and support.
Website Upgradation is going on for any glitch kindly connect at [email protected]