
Every week, thousands of media buyers perform the same ritual, opening Meta Ads Manager, scanning metrics, and deciding which campaigns and ads were winners and which were losers. If ROAS is positive, they’re pleased. If not, the mouse quickly heads toward the toggle button to disable the asset. This is the scoreboard trap some advertisers fall into.
When you treat metrics like a scoreboard, you’re looking at the outcome without understanding the full picture or how to improve going forward. The score of the game doesn’t include the fact that your strikers aren’t getting any passes from midfield.
To scale performance, it’s important to move from reporting to diagnosing the issues at hand. Start looking at your metrics as independent KPIs and as a system of interdependent signals to better tell the story of what’s happening in your account and accurately inform your next optimization steps.
The dashboard illusion
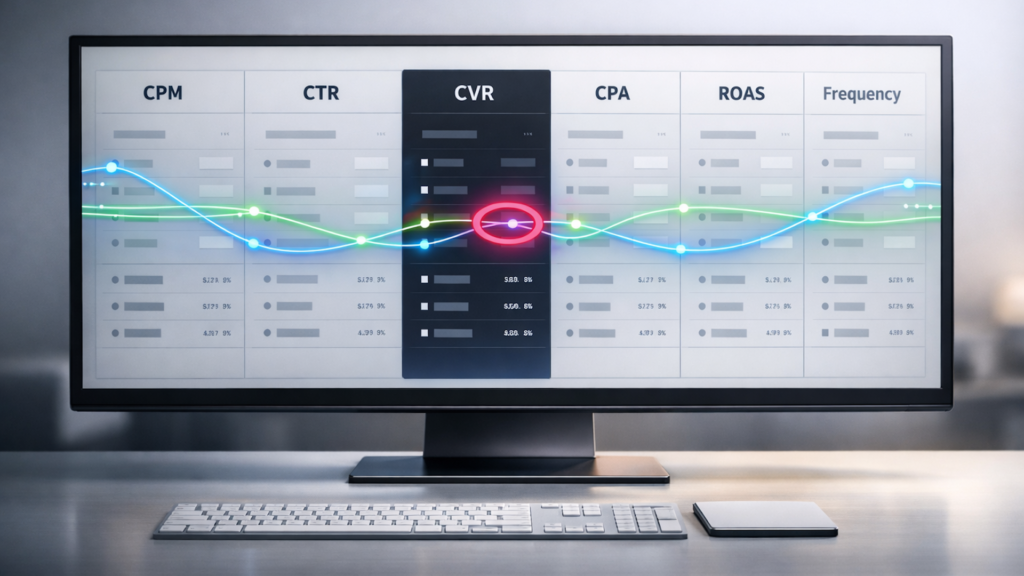
Meta’s interface is designed as a linear grid, which can create a false sense of clarity. It may suggest that a high CPM is the problem in one column and, in another, that a low CTR is the culprit. In reality, these metrics are deeply intertwined.
A high CPM might not mean your audience is expensive. It may indicate your creative is low quality, so Meta is charging you more for a poor user experience on its platform.
Conversely, a high CTR might look like a win at first glance, but if your CVR is plummeting, it’s not a win, and you’re paying for high-intent customers your landing page can’t close.
The dashboard tells you what happened, and the system tells you why.

Dig deeper: Inside Meta’s AI-driven advertising system: How Andromeda and GEM work together
The team metrics framework
To better understand the system, let’s think of metrics as a sports team. Each player has a specific role. If the team loses, you don’t bench the whole team. You review the play to see what happened so you can improve your chances of winning next time.
The scouts: CPM and reach
CPM is the auction’s feedback on your total value. It’s a combination of your bid, estimated action rates, and value to the user. Together, their role is market resonance.
If CPM spikes relative to your historical average, these metrics signal the market is either too crowded or your creative isn’t effective enough to maintain volume.
The midfielders: CTR and hook rate
Their role is to move the ball from the ad placement in Meta’s ecosystem to your website. If you have a high hook rate but a low CTR, your ad is great at getting attention but terrible at passing the ball. You’re stopping the scroll effectively, but your content isn’t enticing people to click.
The strikers: CVR and AOV
These metrics are the final step in the journey and rely on your website. If CTR is high and CPC is low, but ROAS is low,…
Source link
Disclaimer
We strive to uphold the highest ethical standards in all of our reporting and coverage. We blogs.grocliq.com want to be transparent with our readers about any potential conflicts of interest that may arise in our work. It’s possible that some of the investors we feature may have connections to other businesses, including competitors or companies we write about. However, we want to assure our readers that this will not have any impact on the integrity or impartiality of our reporting. We are committed to delivering accurate, unbiased news and information to our audience, and we will continue to uphold our ethics and principles in all of our work. Thank you for your trust and support.
Website Upgradation is going on for any glitch kindly connect at [email protected]